pygimli.utils#
Useful utility functions.
Overview#
Functions
|
Transform any Gauss-Krueger to UTM autodetect GK zone from offset. |
|
Return real/imaginary parts retrieved by Kramers-Kronig relations. |
|
Print string centered in a box. |
|
Return default colormap for physical quantity name. |
|
Cache decorator. |
|
Return chi square value. |
|
Return default colormap for physical quantity name. |
|
Compute inverse square root (C^{-0.5} of matrix. |
|
Converts CRS indices to uncompressed indices (row, col). |
|
Geostatistical covariance matrix (cell or node) for given mesh. |
|
Return datetime as string (e.g. for saving results). |
|
|
|
Create the path structure specified by list. |
|
|
|
Create a result Folder. |
|
|
|
Create the progressive, i.e., cumulative length for a path p. |
|
Cut array v into n parts. |
|
Split data in lines for line-wise processing. |
|
Calculate approximate derivative. |
|
Calculate the distance for each position in p relative to pos c(x,y,z). |
|
Compute minimum distance to segmented Line. |
|
TODO DOCUMENTME. |
|
Filter lines from file.readlines() beginning with symbols in comment. |
|
TODO DOCUMENTME. |
|
Find utm zone for lon and lat values. |
|
Generate geostatistical model (cell or node) for given mesh. |
|
TODO DOCUMENTME. |
|
Syntactic sugar to get some default Projections. |
|
TODO. |
|
Create and return the current coordinate projection. |
|
Convert pygimli matrix into numpy.array. |
|
Create array with possible increasing spacing. |
|
Filter coefficients for Hankel transformation. |
|
numpy.interp interpolation function extended by linear extrapolation. |
|
Return symmetric interpercentiles for alpha-trim outliers. |
|
Return point of integral (cumulative) histogram. |
|
Check numpy or pg.Vector if have complex data type |
|
Find parameter bounds by iterating model parameter. |
|
Create logarithmic scaled copy of p. |
|
Formal model covariance matrix (MCM) from inversion. |
Formal model resolution matrix (MRM) from inversion. |
|
|
Compute the root mean square excluding nan values. |
|
Nice logarithmic space from decade < vMin to decade > vMax. |
|
Set the caching to noCache mode. |
|
List of strings (deprecated, for backward-compatibility). |
|
Convert numpy.array into pygimli RMatrix. |
|
Determine whether a point is inside a closed polygon. |
|
Return prettified string for value . |
|
Return prettified string for a float value. |
|
Return prettified time in seconds as string. |
|
Create RVector of length n with normally distributed random numbers. |
|
Create n normally distributed random numbers with optional seed. |
|
Extract GPS Waypoint from GPS Exchange Format (GPX). |
|
Compute the root mean square. |
|
Compute (abs-)root-mean-square of values with error above threshold. |
|
Compute (abs-)root-mean-square of values with error above threshold. |
|
Round float using a number of counting digits. |
|
Compute the relative (regarding a) root mean square. |
|
Save rms/chi2 results into filename. |
|
Extract indices and value from sparse matrix (SparseMap or CRS) |
|
Convert sparse matrix to dense ndarray |
|
Convert SparseMatrix to scipy.coo_matrix. |
Convert SparseMatrix to scipy.csr_matrix. |
|
|
Squeeze complex valued array into [real, imag] or [amp, phase(rad)] |
|
Create a hash value for the given string. |
|
Create a streamline from start coordinate and following a vector field in up and down direction. |
|
down = -1, up = 1, both = 0 |
|
|
|
|
|
Convert real values into complex (z = a + ib) valued array. |
|
Convert complex (z = a + ib) values array into amplitude and phase in radiant |
|
Convert complex valued matrix into a real valued Blockmatrix |
Convert any matrix type to pg.SparseMatrix and return copy of it. |
|
Convert any matrix type to pg.SparseMatrix and return copy of it. |
|
|
Return properly formatted docstring. |
|
TODO DOCUMENTME. |
|
Return list of unique elements ever seen with preserving order. |
|
Sum double values found by indices in a various number of arrays. |
|
Return iterator of unique elements ever seen with preserving order. |
|
Return the name of a physical quantity with its unit. |
|
Create a hash value for the given value. |
Classes
|
Interpolation class for digital elevation models. |
|
Animated text-based progress bar. |
Functions#
- pygimli.utils.GKtoUTM(ea, no=None, zone=32, gk=None, gkzone=None)[source]#
Transform any Gauss-Krueger to UTM autodetect GK zone from offset.
- pygimli.utils.KramersKronig(f, re, im, usezero=False)[source]#
Return real/imaginary parts retrieved by Kramers-Kronig relations.
formulas including singularity removal according to Boukamp (1993)
- pygimli.utils.boxprint(s, width=80, sym='#')[source]#
Print string centered in a box.
Examples
>>> from pygimli.utils import boxprint
>>> boxprint("This is centered in a box.", width=40, sym='+')
++++++++++++++++++++++++++++++++++++++++
+      This is centered in a box.      +
++++++++++++++++++++++++++++++++++++++++
- pygimli.utils.cMap(name)#
Return default colormap for physical quantity name.
- pygimli.utils.cache(func)[source]#
Cache decorator.
This decorator caches the return value of the function and stores it in a Cache object. If the function is called again with the same arguments, the cached value is returned instead of calling the function again. If the cache is not found, the function is called and the result is stored in the cache.
This can be used without using the decorator by calling: pg.cache(func)(*args, **kwargs)
- Parameters:
func (function) – The function to cache.
- Returns:
wrapper – A wrapper function that caches the return value of the function.
- Return type:
function
- pygimli.utils.computeInverseRootMatrix(CM, thrsh=0.001, verbose=False)[source]#
Compute inverse square root (C^{-0.5} of matrix.
- pygimli.utils.convertCRSIndex2Map(rowIdx, colPtr)[source]#
Converts CRS indices to uncompressed indices (row, col).
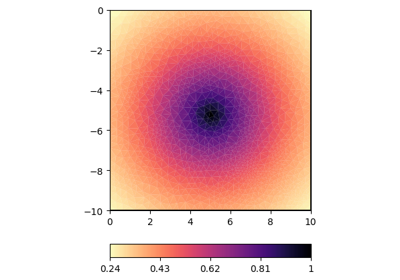
- pygimli.utils.covarianceMatrix(mesh, nodes=False, **kwargs)[source]#
Geostatistical covariance matrix (cell or node) for given mesh.
- Parameters:
mesh (gimliapi:GIMLI::Mesh) – Mesh
nodes (bool [False]) – use node positions, otherwise (default) cell centers are used
**kwargs –
- Ifloat or list of floats
correlation lengths (range) in individual directions
- dipfloat
dip angle (in degree) of major axis (I[0])
- strikefloat
strike angle (for 3D)
- Returns:
Cm – covariance matrix
- Return type:
np.array (square matrix of size cellCount/nodeCount)
Examples using pygimli.utils.covarianceMatrix
- pygimli.utils.createDateTimeString(now=None)[source]#
Return datetime as string (e.g. for saving results).
- pygimli.utils.createFolders(*args, **kwargs)#
- pygimli.utils.createPath(pathList)[source]#
Create the path structure specified by list.
- Parameters:
pathList (str | list(str)) – Create Path with option subpaths
- pygimli.utils.createResultFolder(*args, **kwargs)#
- pygimli.utils.createfolders(*args, **kwargs)#
- pygimli.utils.cumDist(p)[source]#
Create the progressive, i.e., cumulative length for a path p.
d = [0.0, d[0]+ | p[1]-p[0] |, d[1] + | p[2]-p[1] | + …]
- Variables:
p (ndarray(N,2) | ndarray(N,3) | pg.PosVector) – Position array
- Returns:
d – Distance array
- Return type:
ndarray(N)
Examples
>>> import pygimli as pg
>>> from pygimli.utils import cumDist
>>> import numpy as np
>>> p = pg.PosVector(4)
>>> p[0] = [0.0, 0.0]
>>> p[1] = [0.0, 1.0]
>>> p[2] = [0.0, 1.0]
>>> p[3] = [0.0, 0.0]
>>> print(cumDist(p))
[0. 1. 1. 2.]
- pygimli.utils.detectLines(x, y, mode=None, axis='x', show=False)[source]#
Split data in lines for line-wise processing.
- Several modes are available:
‘x’/’y’: along coordinate axis spacing vector: by given spacing float: minimum distance
- pygimli.utils.diff(v)[source]#
Calculate approximate derivative.
Calculate approximate derivative from v as d = [v_1-v_0, v2-v_1, …]
- Parameters:
v (array(N) | pg.PosVector(N)) – Array of double values or positions
- Returns:
d – derivative array
- Return type:
[type(v)](N-1) |
Examples
>>> import pygimli as pg
>>> from pygimli.utils import diff
>>> p = pg.PosVector(4)
>>> p[0] = [0.0, 0.0]
>>> p[1] = [0.0, 1.0]
>>> print(diff(p)[0])
RVector3: (0.0, 1.0, 0.0)
>>> print(diff(p)[1])
RVector3: (0.0, -1.0, 0.0)
>>> print(diff(p)[2])
RVector3: (0.0, 0.0, 0.0)
>>> p = pg.Vector(3)
>>> p[0] = 0.0
>>> p[1] = 1.0
>>> p[2] = 2.0
>>> print(diff(p))
2 [1.0, 1.0]
- pygimli.utils.dist(p, c=None)[source]#
Calculate the distance for each position in p relative to pos c(x,y,z).
- Parameters:
p (ndarray(N,2) | ndarray(N,3) | pg.PosVector) – Position array
c ([x,y,z] [None]) – relative origin. default = [0, 0, 0]
- Returns:
d – Distance array
- Return type:
ndarray(N)
Examples
>>> import pygimli as pg
>>> from pygimli.utils import dist
>>> import numpy as np
>>> p = pg.PosVector(4)
>>> p[0] = [0.0, 0.0]
>>> p[1] = [0.0, 1.0]
>>> print(dist(p))
[0. 1. 0. 0.]
>>> x = pg.Vector(4, 0)
>>> y = pg.Vector(4, 1)
>>> print(dist(np.array([x, y]).T))
[1. 1. 1. 1.]
- pygimli.utils.distToLine(x, y, lx, ly)[source]#
Compute minimum distance to segmented Line.
- Parameters:
x (iterable) – x and y positions
y (iterable) – x and y positions
lx (iterable) – position of points creating a line
ly (iterable) – position of points creating a line
- pygimli.utils.filterLinesByCommentStr(lines, comment_str='#')[source]#
Filter lines from file.readlines() beginning with symbols in comment.
- pygimli.utils.findUTMZone(lon, lat)[source]#
Find utm zone for lon and lat values.
lon -180 – -174 -> 1 … 174 – 180 -> 60 lat < 0 hemisphere = S, > 0 hemisphere = N
- Parameters:
lon (float)
lat (float)
- Returns:
zone + hemisphere
- Return type:
str
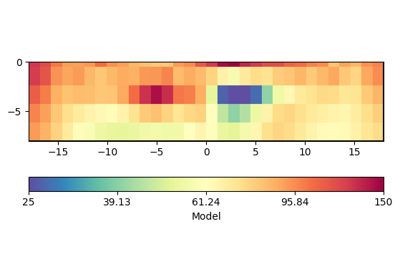
- pygimli.utils.generateGeostatisticalModel(mesh, nodes=False, seed=None, **kwargs)[source]#
Generate geostatistical model (cell or node) for given mesh.
- Parameters:
mesh (gimliapi:GIMLI::Mesh) – Mesh
nodes (bool [False]) – use node positions, otherwise (default) cell centers are used
seed (int, array_like[ints], SeedSequence, BitGenerator, Generator}, optional) – A seed to initialize the BitGenerator. If None, then fresh, unpredictable entropy will be used. The seed variable is passed to
numpy.random.default_rng()**kwargs –
- Ifloat or list of floats
correlation lengths (range) in individual directions
- dipfloat
dip angle of major axis (I[0])
- strikefloat
strike angle (for 3D)
- Returns:
res
- Return type:
np.array of size cellCount or nodeCount (nodes=True)
Examples using pygimli.utils.generateGeostatisticalModel
- pygimli.utils.getProjection(name, ref=None, **kwargs)[source]#
Syntactic sugar to get some default Projections.
- pygimli.utils.getUTMProjection(zone, ellps='WGS84')[source]#
Create and return the current coordinate projection.
This is a proxy for pyproj.
- Parameters:
utmZone (str) – Zone for for UTM
ellipsoid (str) – ellipsoid based on [‘wgs84’]
- Return type:
Pyproj Projection
- pygimli.utils.gmat2numpy(mat)[source]#
Convert pygimli matrix into numpy.array.
TODO implement correct rval
- pygimli.utils.grange(start, end, dx=0, n=0, log=False)[source]#
Create array with possible increasing spacing.
Create either array from start step-wise filled with dx until end reached [start, end] (like np.array with defined end). Fill the array from start to end with n steps. [start, end] (like np.linespace) Fill the array from start to end with n steps but logarithmic increasing, dx will be ignored.
- Variables:
start (float) – First value of the resulting array
end (float) – Last value of the resulting array
dx (float) – Linear step length, n will be ignored
n (int) – Amount of steps
log (bool) – Logarithmic increasing range of length = n from start to end. dx will be ignored.
- Returns:
ret – Return resulting array
- Return type:
Examples
>>> from pygimli.utils import grange
>>> v1 = grange(start=0, end=10, dx=3)
>>> v2 = grange(start=0, end=10, n=3)
>>> print(v1)
4 [0.0, 3.0, 6.0, 9.0]
>>> print(v2)
3 [0.0, 5.0, 10.0]
Examples using pygimli.utils.grange
- pygimli.utils.hankelFC(order)[source]#
Filter coefficients for Hankel transformation.
10 data points per decade.
DOCUMENTME .. Author RUB?
- Parameters:
order (int) – order=1: NY=+0.5 (SIN) order=2: NY=-0.5 (COS) order=3: NY=0.0 (J0) order=4: NY=1.0 (J1)
- Returns:
fc (np.array()) – Filter coefficients
nc0 (int) – fc[nc0] refers to zero argument
- pygimli.utils.interpExtrap(x, xp, yp)[source]#
numpy.interp interpolation function extended by linear extrapolation.
- pygimli.utils.interperc(a, trimval=3.0, islog=False, bins=None)[source]#
Return symmetric interpercentiles for alpha-trim outliers.
E.g. interperc(a, 3) returns range of inner 94% (3 to 97%) which is particularly useful for colorscales).
- pygimli.utils.inthist(a, vals, bins=None, islog=False)[source]#
Return point of integral (cumulative) histogram.
E.g. inthist(a, [25, 50, 75]) provides quartiles and median of an array
- pygimli.utils.iterateBounds(inv, dchi2=0.5, maxiter=100, change=1.02)[source]#
Find parameter bounds by iterating model parameter.
Find parameter bounds by iterating model parameter until error bound is reached
- Parameters:
inv – gimli inversion object
dchi2 – allowed variation of chi^2 values [0.5]
maxiter – maximum iteration number for parameter iteration [100]
change – changing factor of parameters [1.02, i.e. 2%]
- pygimli.utils.logDropTol(p, dropTol=0.001)[source]#
Create logarithmic scaled copy of p.
Examples
>>> from pygimli.utils import logDropTol
>>> x = logDropTol((-10, -1, 0, 1, 100))
>>> print(x.array())
[-4. -3.  0.  3.  5.]
Examples using pygimli.utils.logDropTol
- pygimli.utils.modelCovariance(inv)[source]#
Formal model covariance matrix (MCM) from inversion.
- Parameters:
inv (pygimli inversion object)
- Returns:
var (variances (inverse square roots of MCM matrix))
MCMs (scaled MCM (such that diagonals are 1.0))
Examples
>>> # import pygimli as pg
>>> # import matplotlib.pyplot as plt
>>> # from matplotlib.cm import bwr
>>> # INV = pg.Inversion(data, f)
>>> # par = INV.run()
>>> # var, MCM = modCovar(INV)
>>> # i = plt.imshow(MCM, interpolation='nearest',
>>> #                 cmap=bwr, vmin=-1, vmax=1)
>>> # plt.colorbar(i)
- pygimli.utils.modelResolutionMatrix(inv)[source]#
Formal model resolution matrix (MRM) from inversion.
- Parameters:
inv (pg.Inversion (pygimli.framework.Inversion))
- Returns:
MR
- Return type:
pg.Matrix (pg.matrix.core.RMatrix dense matrix)
- pygimli.utils.niceLogspace(vMin, vMax, nDec=10)[source]#
Nice logarithmic space from decade < vMin to decade > vMax.
- Parameters:
vMin (float) – lower limit need to be > 0
vMax (float) – upper limit need to be >= vMin
nDec (int) – Amount of logarithmic equidistant steps for one decade
Examples
>>> from pygimli.utils import niceLogspace
>>> v1 = niceLogspace(vMin=0.1, vMax=0.1, nDec=1)
>>> print(v1)
[0.1 1. ]
>>> v1 = niceLogspace(vMin=0.09, vMax=0.11, nDec=1)
>>> print(v1)
[0.01 0.1  1.  ]
>>> v1 = niceLogspace(vMin=0.09, vMax=0.11, nDec=10)
>>> print(len(v1))
21
>>> print(v1)
[0.01       0.01258925 0.01584893 0.01995262 0.02511886 0.03162278
 0.03981072 0.05011872 0.06309573 0.07943282 0.1        0.12589254
 0.15848932 0.19952623 0.25118864 0.31622777 0.39810717 0.50118723
 0.63095734 0.79432823 1.        ]
- pygimli.utils.noCache(c: bool = True)[source]#
Set the caching to noCache mode.
This will disable the caching mechanism and all decorated functions
- pygimli.utils.num2str(a, fmtstr='%g')[source]#
List of strings (deprecated, for backward-compatibility).
- pygimli.utils.numpy2gmat(nmat)[source]#
Convert numpy.array into pygimli RMatrix.
TODO implement correct rval
- pygimli.utils.pointInsidePolygon(x, y, polygon)[source]#
Determine whether a point is inside a closed polygon.
- pygimli.utils.prettify(value, roundValue=False)[source]#
Return prettified string for value .. if possible.
- pygimli.utils.prettyFloat(value, roundValue=None)[source]#
Return prettified string for a float value.
- pygimli.utils.prettyTime(t)[source]#
Return prettified time in seconds as string. No months, no leap year.
- Parameters:
t (float) – Time in seconds, should be > 0
Examples
>>> from pygimli.utils import prettyTime
>>> print(prettyTime(1))
1 s
>>> print(prettyTime(3600*24))
1 day
>>> print(prettyTime(2*3600*24))
2 days
>>> print(prettyTime(365*3600*24))
1 year
>>> print(prettyTime(3600))
1 hour
>>> print(prettyTime(2*3600))
2 hours
>>> print(prettyTime(3660))
1h1m
>>> print(prettyTime(1e-3))
1 ms
>>> print(prettyTime(1e-6))
1 µs
>>> print(prettyTime(1e-9))
1 ns
- pygimli.utils.rand(n, minVal=0.0, maxVal=1.0, seed=None)[source]#
Create RVector of length n with normally distributed random numbers.
- pygimli.utils.randn(n, seed=None)[source]#
Create n normally distributed random numbers with optional seed.
- Parameters:
n (long) – length of random numbers array.
seed (int[None]) – Optional seed for random number generator
- Returns:
r – Random numbers.
- Return type:
np.array
Examples
>>> import numpy as np
>>> from pygimli.utils import randn
>>> a = randn(5, seed=1337)
>>> b = randn(5)
>>> c = randn(5, seed=1337)
>>> print(np.array_equal(a, b))
False
>>> print(np.array_equal(a, c))
True
- pygimli.utils.readGPX(fileName)[source]#
Extract GPS Waypoint from GPS Exchange Format (GPX).
Currently only simple waypoint extraction is supported.
<gpx version=”1.0” creator=”creator”>
<metadata> <name>Name</name> </metadata> <wpt lat=”51.” lon=”11.”> <name>optional</name> <time>optional</time> <description>optional</description> </wpt>
</gpx>
- pygimli.utils.rmsWithErr(a, b, err, errtol=1)[source]#
Compute (abs-)root-mean-square of values with error above threshold.
- pygimli.utils.rmswitherr(a, b, err, errtol=1)#
Compute (abs-)root-mean-square of values with error above threshold.
- pygimli.utils.saveResult(fname, data, rrms=None, chi2=None, mode='w')[source]#
Save rms/chi2 results into filename.
- pygimli.utils.sparseMatrix2Array(matrix, indices=True, getInCRS=True)[source]#
Extract indices and value from sparse matrix (SparseMap or CRS)
Get python Arrays from SparseMatrix or SparseMapMatrix in either CRS convention (row index, column Start_End, values) or row index, column index, values.
- Parameters:
matrix (pg.matrix.SparseMapMatrix or pg.matrix.SparseMatrix) – Input matrix to be transformed to numpy arrays.
indices (boolean (True)) – Decides weather the indices of the matrix will be returned or not.
getInCSR (boolean (True)) – If returned, the indices can have the format of a compressed row storage (CSR), the default or uncompressed lists with column and row indices.
- Returns:
vals (numpy.ndarray) – Entries of the matrix.
indices (list, list) – Optional. Returns additional array with the indices for reconstructing the matrix in the defined format.
- pygimli.utils.sparseMatrix2coo(A, rowOffset=0, colOffset=0)[source]#
Convert SparseMatrix to scipy.coo_matrix.
- Parameters:
A (pg.matrix.SparseMapMatrix | pg.matrix.SparseMatrix) – Matrix to convert from.
- Returns:
mat – Matrix to convert into.
- Return type:
scipy.coo_matrix
- pygimli.utils.sparseMatrix2csr(A)[source]#
Convert SparseMatrix to scipy.csr_matrix.
Compressed Sparse Row matrix, i.e., Compressed Row Storage (CRS)
- Parameters:
A (pg.matrix.SparseMapMatrix | pg.matrix.SparseMatrix) – Matrix to convert from.
- Returns:
mat – Matrix to convert into.
- Return type:
scipy.csr_matrix
- pygimli.utils.squeezeComplex(z, polar=False, conj=False)[source]#
Squeeze complex valued array into [real, imag] or [amp, phase(rad)]
- pygimli.utils.strHash(s: str) int[source]#
Create a hash value for the given string.
Uses sha224 to create a 16 byte hash value.
- Parameters:
s (str) – The string to hash.
- Returns:
hash – The hash value of the string.
- Return type:
int
- pygimli.utils.streamline(mesh, field, startCoord, dLengthSteps, dataMesh=None, maxSteps=1000, verbose=False, coords=(0, 1))[source]#
Create a streamline from start coordinate and following a vector field in up and down direction.
- pygimli.utils.streamlineDir(mesh, field, startCoord, dLengthSteps, dataMesh=None, maxSteps=150, down=True, verbose=False, coords=(0, 1))[source]#
down = -1, up = 1, both = 0
- pygimli.utils.toComplex(amp, phi=None)[source]#
Convert real values into complex (z = a + ib) valued array.
If no phases phi are given, assuming z = amp[0:N] + i amp[N:2N].
If phi is given in (rad) complex values are generated: z = amp*(cos(phi) + i sin(phi))
- Parameters:
amp (iterable (float)) – Amplitudes or real unsqueezed real valued array.
phi (iterable (float)) – Phases in neg radiant
- Returns:
z – Complex values
- Return type:
ndarray(dtype=np.complex)
Examples using pygimli.utils.toComplex
- pygimli.utils.toPolar(z)[source]#
Convert complex (z = a + ib) values array into amplitude and phase in radiant
If z is real valued we assume its squeezed.
- Parameters:
z (iterable (floats, complex)) – If z contains of floats and squeezedComplex is assumed [real, imag]
- Returns:
amp, phi – Amplitude amp and phase angle phi in radiant.
- Return type:
ndarray
- pygimli.utils.toRealMatrix(C, conj=False)[source]#
Convert complex valued matrix into a real valued Blockmatrix
- Parameters:
C (CMatrix) – Complex valued matrix
conj (bool [False]) – Fill the matrix as complex conjugated matrix
- Returns:
R
- Return type:
pg.matrix.BlockMatrix()
- pygimli.utils.toSparseMapMatrix(A)[source]#
Convert any matrix type to pg.SparseMatrix and return copy of it.
- Parameters:
A (pg or scipy matrix)
- Return type:
pg.SparseMatrix
- pygimli.utils.toSparseMatrix(A)[source]#
Convert any matrix type to pg.SparseMatrix and return copy of it.
No conversion if A is a SparseMatrix already :param A: :type A: pg or scipy matrix
- Return type:
pg.SparseMatrix
- pygimli.utils.trimDocString(docstring)[source]#
Return properly formatted docstring.
From: https://www.python.org/dev/peps/pep-0257/
Examples
>>> from pygimli.utils import trimDocString
>>> docstring = '    This is a string with indentation and whitespace.   '
>>> trimDocString(docstring).replace('with', 'without')
'This is a string without indentation and whitespace.'
- pygimli.utils.unique(a)[source]#
Return list of unique elements ever seen with preserving order.
Examples
>>> from pygimli.utils import unique
>>> unique((1,1,2,2,3,1))
[1, 2, 3]
See also
unique_everseen,unique_rows
- pygimli.utils.uniqueAndSum(indices, to_sum, return_index=False, verbose=False)[source]#
Sum double values found by indices in a various number of arrays.
Returns the sorted unique elements of a column_stacked array of indices. Another column_stacked array is returned with values at the unique indices, while values at double indices are properly summed.
- Parameters:
ar (array_like) – Input array. This will be flattened if it is not already 1-D.
to_sum (array_like) – Input array to be summed over axis 0. Other existing axes will be broadcasted remain untouched.
return_index (bool, optional) – If True, also return the indices of ar (along the specified axis, if provided, or in the flattened array) that result in the unique array.
- Returns:
unique (ndarray) – The sorted unique values.
summed_array (ndarray) – The summed array, whereas all values for a specific index is the sum over all corresponding nonunique values.
unique_indices (ndarray, optional) – The indices of the first occurrences of the unique values in the original array. Only provided if return_index is True.
Examples
>>> import numpy as np
>>> from pygimli.utils import uniqueAndSum
>>> idx1 = np.array([0, 0, 1, 1, 2, 2])
>>> idx2 = np.array([0, 0, 1, 2, 3, 3])
>>> # indices at positions 0 and 1 and at positions 5 and 6 are not unique
>>> to_sort = np.column_stack((idx1, idx2))
>>> # its possible to stack more than two array
>>> # you need for example 3 array to find unique node positions in a mesh
>>> values = np.arange(0.1, 0.7, 0.1)
>>> print(values)
[0.1 0.2 0.3 0.4 0.5 0.6]
>>> # some values to be summed together (for example attributes of nodes)
>>> unique_idx, summed_vals = uniqueAndSum(to_sort, values)
>>> print(unique_idx)
[[0 0]
 [1 1]
 [1 2]
 [2 3]]
>>> print(summed_vals)
[0.3 0.3 0.4 1.1]
- pygimli.utils.unique_everseen(iterable, key=None)[source]#
Return iterator of unique elements ever seen with preserving order.
Return iterator of unique elements ever seen with preserving order.
From: https://docs.python.org/3/library/itertools.html#itertools-recipes
Examples
>>> from pygimli.utils import unique_everseen
>>> s1 = 'AAAABBBCCDAABBB'
>>> s2 = 'ABBCcAD'
>>> list(unique_everseen(s1))
['A', 'B', 'C', 'D']
>>> list(unique_everseen(s2, key=str.lower))
['A', 'B', 'C', 'D']
See also
unique,unique_rows
Classes#
- class pygimli.utils.DEM(demfile, x=None, y=None, **kwargs)[source]#
Bases:
objectInterpolation class for digital elevation models.
- __init__(demfile, x=None, y=None, **kwargs)[source]#
Initialize DGM (regular grid) interpolation object.
- Parameters:
demfile (str or iterable elevations (list, ndarray)) – digital elevation file: * ASC file with lower left corner and spacing in header OR * x, y, z list of grid points or irregular points
x (iterable of (unique) x and y positions matching z)
y (iterable of (unique) x and y positions matching z)
- Keyword Arguments:
toLatLon (callable(x, y) [None]) – Custom coordinate translator. If set to None then lambda x_, y_: utm.to_latlon(x_, y_, zone, ‘N’) is taken.
zone (int [32]) – UTM zone to be chosen
- add(new, createGrid=True)[source]#
Combine two DEM by concatenatation.
x or y vectors must be equal (e.g. for 1° SRTM models).
- Parameters:
new (DEM | str) – DEM instance or string to load
- show(cmap='terrain', cbar=True, ax=None, **kwargs)[source]#
Show digital elevation model (i.e. the elevation map).
- Parameters:
cmap (str="terrain") – matplotlib colormap definition
cbar (bool=True) – Add colorbar to the plot or not.
ax (matplotlib axes object) – Add the plot to a given axes object or create a new one.
- Keyword Arguments:
arguments (**kwargs, type keyword) – Additional keyword arguments forwarded to mpl plot.
- class pygimli.utils.ProgressBar(its, width=80, sign=':', **kwargs)[source]#
Bases:
objectAnimated text-based progress bar.
Animated text-based progressbar for intensive loops. Should work in the console. In IPython Notebooks a ‘tqdm’ progressbar instance is created and can be configured with appropriate keyword arguments.
- __init__(its, width=80, sign=':', **kwargs)[source]#
Create animated text-based progress bar.
TODO * optional: ‘estimated time’ instead of ‘x of y complete’
- itsint
Number of iterations of the process.
- widthint
Width of the ProgressBar, default is 80.
- signstr
Sign used to fill the bar.
Forwarded to create the tqdm progressbar instance. See https://tqdm.github.io/docs/tqdm/
>>> from pygimli.utils import ProgressBar
>>> pBar = ProgressBar(its=20, width=40, sign='+')
>>> pBar.update(5)
[+++++++++++ 30% ] 6 of 20 complete