pygimli.viewer#
Note
For 2D and 3D visualizations, we rely on matplotlib (www.matplotlib.org) and pyvista (www.pyvista.org), respectively.
Interface for 2D and 3D visualizations.
Module overview
Functions#
- pygimli.viewer.show(obj=None, data=None, **kwargs)[source]#
Mesh and model visualization.
Syntactic sugar to show a obj with data. Forwards to a known visualization for obj. Typical is
pygimli.viewer.showMeshorpygimli.viewer.pv.showMesh3Dto show most of the typical 2D and 3D content. See tutorials and examples for usage hints. An empty show call creates an empty ax window.- Parameters:
obj (obj) – obj can be so far. * GIMLI::Mesh or list of meshes * DataContainer * pg.core.Sparse[Map]Matrix
data (iterable) – Optionally data to visualize. See appropriate show function.
- Keyword Arguments:
**kwargs –
Additional kwargs forward to appropriate show functions.
- axaxe [None]
Matplotlib axes object. Create a new if necessary.
- fitViewbool [True]
Scale x and y limits to match the view.
- Returns:
Return the results from the showMesh functions. Usually the axe object*
and a colorbar.
See also
- pygimli.viewer.showMesh(mesh, data=None, block=False, colorBar=None, label=None, coverage=None, ax=None, savefig=None, showMesh=False, showBoundary=None, factor=1, markers=False, **kwargs)[source]#
2D Mesh visualization.
Create an axis object and plot a 2D mesh with given node or cell data. Returns the axis and the color bar. The type of data determines the appropriate draw method.
- Parameters:
mesh (GIMLI::Mesh) – 2D or 3D GIMLi mesh
data (iterable [None]) –
Optionally data to visualize.
- . None (draw mesh only)
forward to
pygimli.viewer.mpl.drawMeshor if no cells are given: forward topygimli.viewer.mpl.drawPLC- . [[marker, value], …]
List of Cellvalues per cell marker forward to
pygimli.viewer.mpl.drawModel- . float per cell – model, patch
forward to
pygimli.viewer.mpl.drawModel- . float per node – scalar field
forward to
pygimli.viewer.mpl.drawField- . iterable of type [float, float] – vector field
forward to
pygimli.viewer.mpl.drawStreams- . pg.PosVector – vector field
forward to
pygimli.viewer.mpl.drawStreams- . pg.core.stdVectorRVector3 – sensor positions
forward to
pygimli.viewer.mpl.drawSensors
block (bool [False]) – Force to open the Figure of your content and blocks the script until you close the current figure. Same like pg.show(); pg.wait()
colorBar (bool [None], Colorbar) – Create and show a colorbar. If colorBar is a valid colorbar then only its values will be updated.
label (str) – Set colorbar label. If set colorbar is toggled to True. [None]
coverage (iterable [None]) – Weight data by the given coverage array and fadeout the color.
ax (matplotlib.Axes [None]) – Instead of creating a new and empty ax, just draw into the given one. Useful to combine multiple plots into one figure.
savefig (string) – Filename for a direct save to disc.
showMesh (bool [False]) – Shows the mesh itself additional.
showBoundary (bool [None]) – Highlight all boundaries with marker != 0. None means automatic. True for cell data and False for node data.
marker (bool [False]) – Show cell markers and boundary marker.
boundaryMarkers (bool [False]) – Highlight boundaries with marker !=0 and add Marker annotation. Applies
pygimli.viewer.mpl.drawBoundaryMarkers. Dictionary “boundaryProps” can be added and will be forwarded topygimli.viewer.mpl.drawBoundaryMarkers.
- Keyword Arguments:
xl (str ["$x$ in m"]) – Add label to the x axis. Default is ‘$x$ in m’
yl (str [None]) – Add label to the y axis. Default is ‘$y$ in m’ or ‘Depth in m’ with world boundary markers.
fitView (bool) – Fit the axes limits to the all content of the axes. Default True.
boundaryProps (dict) – Arguments for plotboundar
hold (bool [pg.hold()]) – Holds back the opening of the Figure. If set to True [default] nothing happens until you either force another show with hold=False or block=True or call pg.wait() or pg.plt.show(). If hold is set to False your script will open the figure and continue working. You can change global hold with pg.hold(bool).
axisLabels (bool [True]) – Set x/yLabels for ax. X will be “$x$ in m” and “$y$ in m”. Y ticks change to depth values for a mesh with world boundary markers and the label becomes “Depth in m”.
functions (All remaining will be forwarded to the draw)
respectively. (and matplotlib methods,)
Examples
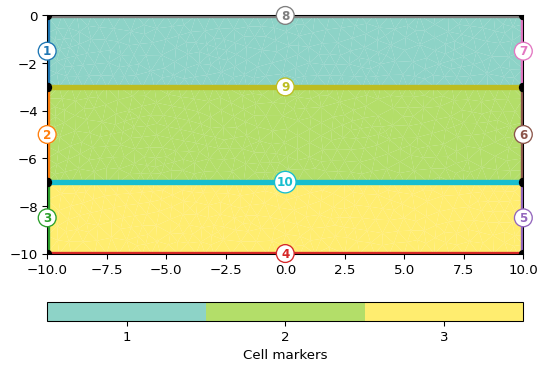
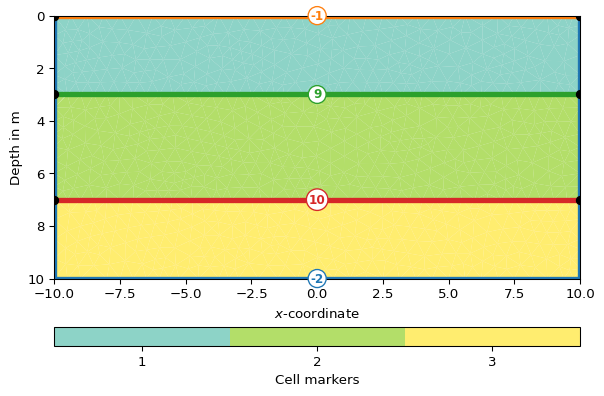
>>> import pygimli as pg
>>> import pygimli.meshtools as mt
>>> world = mt.createWorld(start=[-10, 0], end=[10, -10],
...                        layers=[-3, -7], worldMarker=True)
>>> mesh = mt.createMesh(world, quality=32, area=0.2, smooth=[1, 10])
>>> _ = pg.viewer.showMesh(mesh, markers=True, xl='$x$-coordinate')
- Returns:
ax (matplotlib.axes)
cBar (matplotlib.colorbar)