Note
Go to the end to download the full example code
Quality of unstructured meshes#
Problem:
Accurate numerical solutions require high quality meshes. In the case of unstructured triangular meshes (or tetrahedral meshes in 3D), relatively large and small angles can lead to discretization errors. Large angles can cause interpolation errors, while small angles can lead to ill-conditioned stiffness matrices.
Identification:
Some common 2D quality measures are implemented in
pygimli.meshtoolsand will be used in this tutorial. In 3D, we recommend to export the mesh in VTK format and inspect mesh quality with ParaView (Filters -> Alphapetical -> Mesh quality).
Solution:
Meshes can be improved by adjusting cell sizes (area keyword) and the minimum allowed angle (quality keyword). Gmsh and other more advanced meshing tools also provide powerful mesh optimization algorithms. However, the numerical accurary may be improved at the expense of increased cell counts and thus longer computation times.
import matplotlib.pyplot as plt
import numpy as np

import pygimli as pg
from pygimli.meshtools import polytools as plc
from pygimli.meshtools import quality
We start by creating a mesh with a refined object inside.
world = plc.createWorld(start=[-10, 0], end=[10, -10], marker=1,
                        worldMarker=False)
c1 = plc.createCircle(pos=[0.0, -5.0], radius=3.0, area=.3)
When calling the pg.meshtools.createMesh() function, a quality parameter
can be forwarded to Triangle, which prescribes the minimum angle allowed in
the final mesh. We can asses its effectiveness by creating different meshes
and plotting the resulting quality. For this purpose, we define a showQuality
function, which also plots a histogram of the mesh qualities.
def showQuality(mesh, qualities):
    fig, axes = plt.subplots(1, 2)
    axes[1].hist(qualities, color="grey")
    pg.show(mesh, qualities, ax=axes[0], cMin=0.5, cMax=1, hold=True,
            logScale=False, label="Mesh quality", cmap="RdYlGn", showMesh=True)
    s = "Min: %.2f, Mean: %.2f, Max: %.2f" % (
        np.min(qualities), np.mean(qualities), np.max(qualities))
    axes[1].set_title(s)
    axes[1].set_xlabel("Mesh quality")
    axes[1].set_ylabel("Frequency")
    axes[1].set_xlim(0, 1)

    # Figure resizing according to mesh dimesions
    x = mesh.xmax() - mesh.xmin()
    y = mesh.ymax() - mesh.ymin()
    width, height = fig.get_size_inches()
    fig.set_figheight(height * 1.3 * (y / x))
    fig.tight_layout()


for q in 10, 20, 30:
    m = pg.meshtools.createMesh([world, c1], quality=q)
    showQuality(m, quality(m))
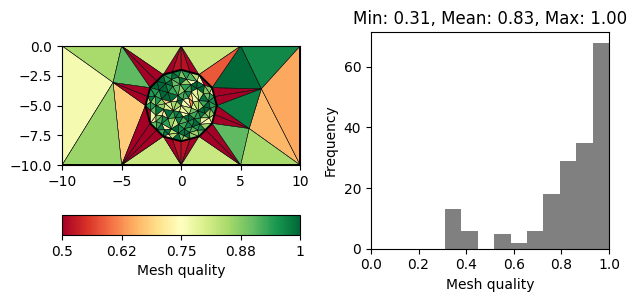
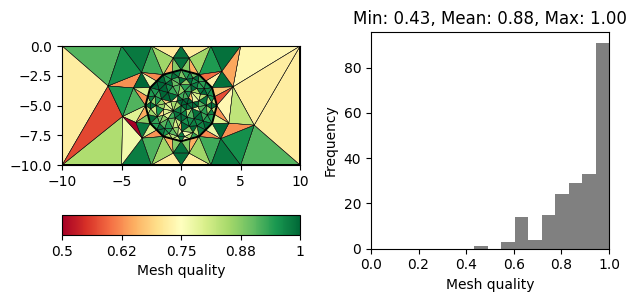
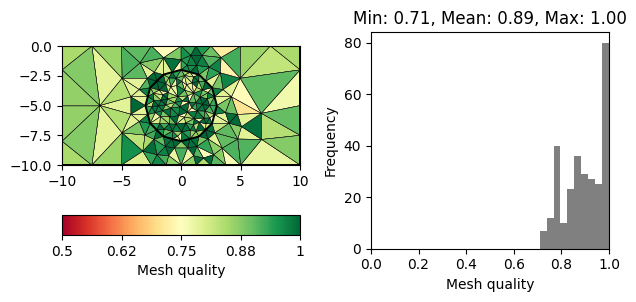
Note that there is a decreasing number of problematic triangles (marked in red). However, the number of cells is increased siginficantly to achieve this.
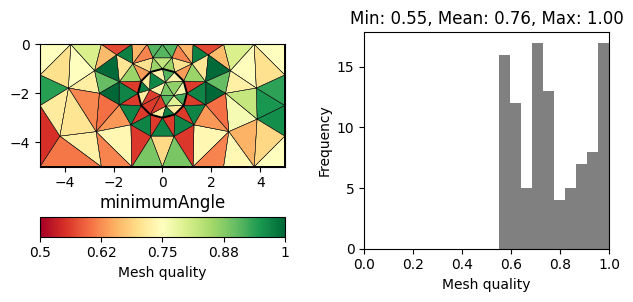
Quality measures#
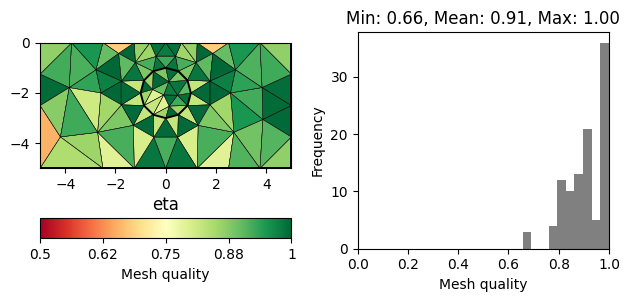
There are numerous measures related to the area/volume, boundary lengths and angles of a cell (see [1] for a review). A straightforward measure considers the minimum angle in a triangle (normalized by 60 degrees). More sophisticated measures also take into account the cell size. A very common measure, often referred to as \(\eta\), relates the area of a triangle \(a\) to its edge lengths \(l_1,l_2,l_3\).
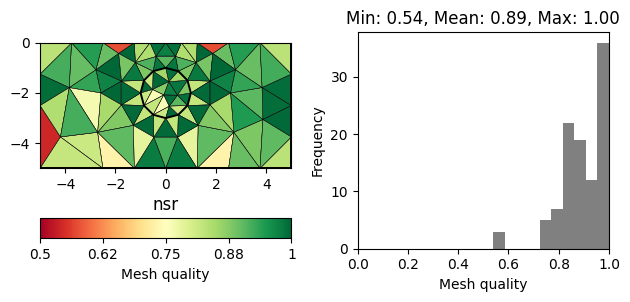
The normalization factor \(4\sqrt{3}\) ensures that a perfect triangle (equal edges) has a quality of 1. A popular measure also applicable for other cell types is the Normalized shape ratio (NSR), which relates the circumradius \(R\) to the inradius of cell (\(r\)).
Again the factor 2 (3 in 3D) ensures that a perfect triangle has a quality of 1, whereas a flat triangle would have a quality of 0. The above mentioned quality measures are plotted below for the same mesh.
world = plc.createWorld(start=[-5, 0], end=[5, -5], marker=1,
                        worldMarker=False, area=2.)
c1 = plc.createCircle(pos=[0.0, -2.0], radius=1.0, area=.3)
mesh = pg.meshtools.createMesh([world, c1])

for measure in "minimumAngle", "eta", "nsr":
    showQuality(mesh, quality(mesh, measure))
    plt.title(measure)

plt.show()
References: