Note
Go to the end to download the full example code
Heat equation in 2D#
This tutorial solves the stationary heat equation in 2D. The example is taken from the pyGIMLi paper (https://cg17.pygimli.org).
import pygimli as pg
import pygimli.meshtools as mt
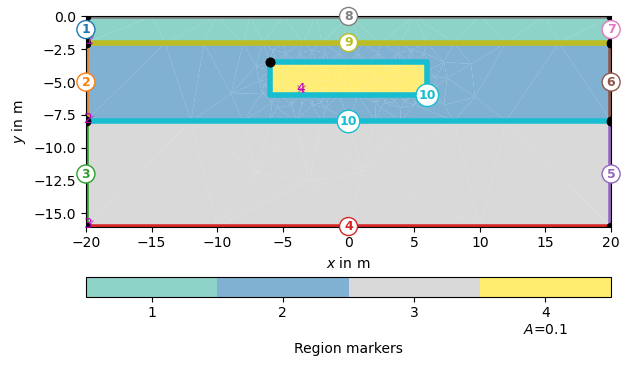
Create geometry definition for the modelling domain.
world = mt.createWorld(start=[-20, 0], end=[20, -16], layers=[-2, -8],
                       worldMarker=False)
# Create a heterogeneous block
block = mt.createRectangle(start=[-6, -3.5], end=[6, -6.0],
                           marker=4,  boundaryMarker=10, area=0.1)
# Merge geometrical entities
geom = world + block
ax, cb = pg.show(geom, markers=True)
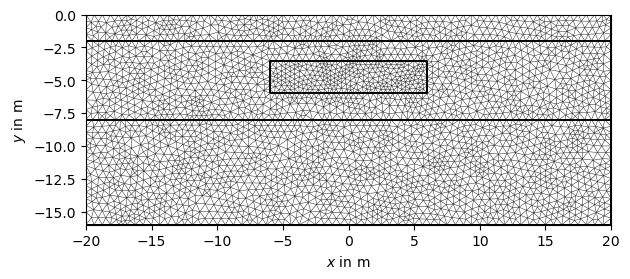
Create a mesh from based on the geometry definition.
When calling the pg.meshtools.createMesh() function, a quality parameter
can be forwarded to Triangle, which prescribes the minimum angle allowed in
the final mesh. For a tutorial on the quality of the mesh please refer to :
Mesh quality inspection [1]
[1]: https://www.pygimli.org/_tutorials_auto/1_basics/plot_6-mesh-quality-inspection.html#sphx-glr-tutorials-auto-1-basics-plot-6-mesh-quality-inspection-py
Note: Incrementing quality increases computer time, take precaution with quality
values over 33.
mesh = mt.createMesh(geom, quality=33, area=0.2, smooth=[1, 10])
ax, _ = pg.show(mesh)
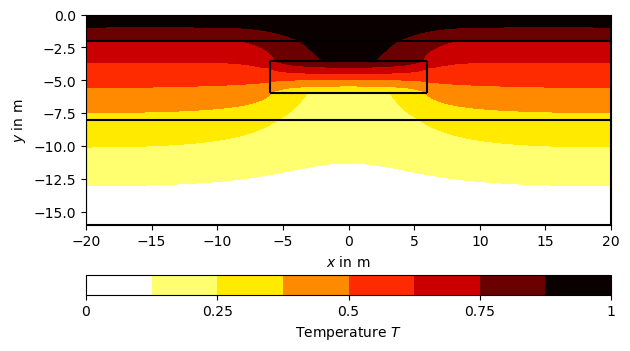
Call pygimli.solver.solveFiniteElements() to solve the heat
diffusion equation \(\nabla\cdot(a\nabla T)=0\) with \(T(bottom)=0\)
(boundary marker 8) and \(T(top)=1\) (boundary marker 4), where \(a\)
is the thermal diffusivity and \(T\) is the temperature distribution.
We assign thermal diffusivities to the four # regions using their marker
numbers in a dictionary (a) and the fixed temperatures at the boundaries
using Dirichlet boundary conditions with the respective markers in another
dictionary (bc)
Mesh:  Mesh: Nodes: 3011 Cells: 5832 Boundaries: 8842
Assembling time:  0.049893468
Solving time:  0.013399571