Note
Go to the end to download the full example code
Region markers#
Author: Maximilian Weigand, University of Bonn
A mesh can have different regions, which are defined by region markers for each cell. Region markers can be used to assign properties for forward modelling as well as to control the inversion behavior. This tutorial highlights the usage of regionMarkers, as well as some properties of regions if the pygimli.meshtools package is used to create complex compound meshes.
When constructing complex geometries out of basic geometric shapes (e.g., circle, rectangle, …) we need to be careful with the region markers and their positions. This example shows how to use markerPositions to properly set region markers.
import pygimli as pg
import pygimli.meshtools as mt
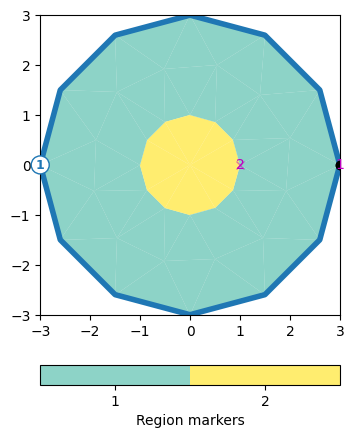
In this first part we naively combine objects and assign markers to them, expecting two regions of concentric rings with markers 1 and 2. Note how the outer ring is assigned the marker 0 in the figure, although we specified marker=1 for the larger circle? A marker value of 0 is assigned to a region if no region marker is found, indicating that the marker for the outer ring was overwritten/ignored by the inner circle, which was added later.
circle_outer = mt.createCircle(pos=[0.0, 0.0], radius=3.0, marker=1)

circle_inner = mt.createCircle(
    pos=[0.0, 0.0],
    radius=1.0,
    # area=.3,
    boundaryMarker=0,
    marker=2)

plc = circle_outer + circle_inner

ax, cb = pg.show(plc, markers=True)
The solution to this problem is the region marker, which defines the marker value of the region that it is placed in. By default all region markers are assigned the position (0,0,0), thereby overwriting each other (see black dots in figure below). If no region marker is present in a region, a marker value of 0 is assigned.
fig = ax.get_figure()
for nr, marker in enumerate(plc.regionMarkers()):
    print('Position marker number {}:'.format(nr + 1), marker.x(), marker.y(),
          marker.z())
    ax.scatter(marker.x(), marker.y(), s=(2 - nr) * 30, color='k')
ax.set_title('marker positions - non-working example')
fig.show()
Position marker number 1: 2.999 -3.700743415417188e-20 0.0
Position marker number 2: 0.999 1.8503717077085942e-20 0.0
Let us fix this issue by assigning region marker positions that are not overwritten by other objects when the geometries are merged (using the markerPosition parameter):
circle_outer = mt.createCircle(
    pos=[0.0, 0.0],
    radius=3.0,
    marker=1,
    markerPosition=[2.95, 0.0],
)

circle_inner = mt.createCircle(
    pos=[0.0, 0.0],
    radius=1.0,
    marker=2,
    markerPosition=[0.95, 0.0],
)

plc = circle_outer + circle_inner

ax, cb = pg.show(plc, markers=True)

fig = ax.get_figure()
for nr, marker in enumerate(plc.regionMarkers()):
    print('Position marker number {}:'.format(nr + 1), marker.x(), marker.y(),
          marker.z())
    ax.scatter(marker.x(), marker.y(), s=(2 - nr) * 30, color='k')
ax.set_title('marker positions - working example')
fig.show()
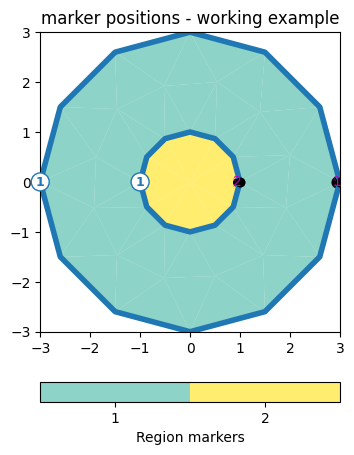
Position marker number 1: 2.95 0.0 0.0
Position marker number 2: 0.95 0.0 0.0
The same issue can occur for polygons. Polygons can assume complex forms, but for simplicity we create cubes here.
polygon1 = mt.createPolygon(
    [[0.0, 0.0], [1.0, 0.0], [1.0, -1.0], [0.0, -1]],
    isClosed=True,
    marker=1,
)

polygon2 = mt.createPolygon(
    [[0.25, -0.25], [0.75, -0.25], [0.75, -0.75], [0.25, -0.75]],
    isClosed=True,
    marker=2,
)

plc = polygon1 + polygon2

ax, cb = pg.show(plc, markers=True)

fig = ax.get_figure()
for nr, marker in enumerate(plc.regionMarkers()):
    print('Position marker number {}:'.format(nr + 1), marker.x(), marker.y(),
          marker.z())
    ax.scatter(marker.x(), marker.y(), s=(4 - nr) * 20, color='k')
ax.set_title('marker positions - non-working example')
fig.show()
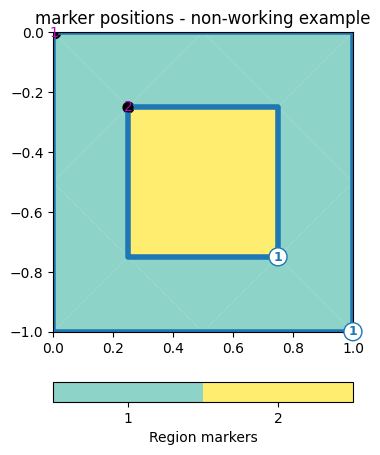
Position marker number 1: 0.0007071067811865475 -0.0007071067811865475 0.0
Position marker number 2: 0.2507071067811866 -0.2507071067811866 0.0
Again, we can simply fix with the markerPosition parameter
polygon1 = mt.createPolygon(
    [[0.0, 0.0], [1.0, 0.0], [1.0, -1.0], [0.0, -1]],
    isClosed=True,
    marker=1,
    markerPosition=[0.9, -0.9],
)

polygon2 = mt.createPolygon(
    [[0.25, -0.25], [0.75, -0.25], [0.75, -0.75], [0.25, -0.75]],
    isClosed=True,
    marker=2,
)

plc = polygon1 + polygon2

ax, cb = pg.show(plc, markers=True)

fig = ax.get_figure()
for nr, marker in enumerate(plc.regionMarkers()):
    print('Position marker number {}:'.format(nr + 1), marker.x(), marker.y(),
          marker.z())
    ax.scatter(marker.x(), marker.y(), s=(4 - nr) * 20, color='k')
ax.set_title('marker positions - working example')
fig.show()
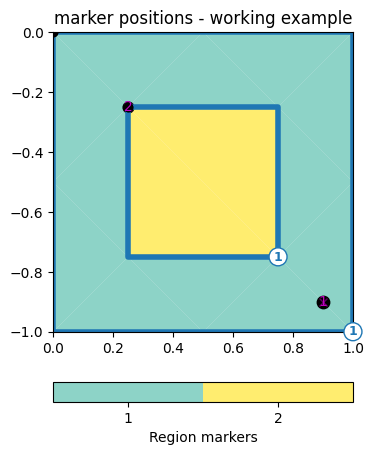
Position marker number 1: 0.9 -0.9 0.0
Position marker number 2: 0.2507071067811866 -0.2507071067811866 0.0
And finally, a similar example for rectangles…
rect1 = mt.createRectangle(
    start=[0.0, 0.0],
    end=[2.0, -1.0],
    isClosed=True,
    marker=1,
)

# move the rectangle by changing the center position
rect2 = mt.createRectangle(
    start=[0.0, 0.0],
    end=[1.0, -0.5],
    isClosed=True,
    marker=2,
)

plc = rect1 + rect2

ax, cb = pg.show(plc, markers=True)

fig = ax.get_figure()
for nr, marker in enumerate(plc.regionMarkers()):
    print('Position marker number {}:'.format(nr + 1), marker.x(), marker.y(),
          marker.z())
    ax.scatter(marker.x(), marker.y(), s=(4 - nr) * 20, color='k')
ax.set_title('marker positions - non-working example')
fig.show()
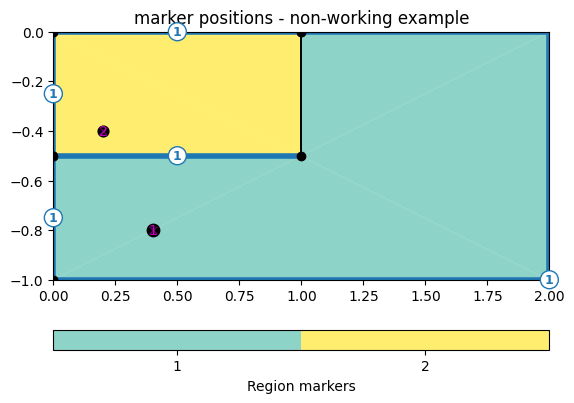
Position marker number 1: 0.4 -0.8 0.0
Position marker number 2: 0.2 -0.4 0.0
For the last time, fixing it…
rect1 = mt.createRectangle(
    start=[0.0, 0.0],
    end=[2.0, -1.0],
    isClosed=True,
    marker=1,
    markerPosition=[1.75, -0.25],
)

# move the rectangle by changing the center position
rect2 = mt.createRectangle(
    start=[0.0, 0.0],
    end=[1.0, -0.5],
    isClosed=True,
    marker=2,
)

plc = rect1 + rect2

ax, cb = pg.show(plc, markers=True)

fig = ax.get_figure()
for nr, marker in enumerate(plc.regionMarkers()):
    print('Position marker number {}:'.format(nr + 1), marker.x(), marker.y(),
          marker.z())
    ax.scatter(marker.x(), marker.y(), s=(4 - nr) * 20, color='k')
ax.set_title('marker positions - working example')
fig.show()
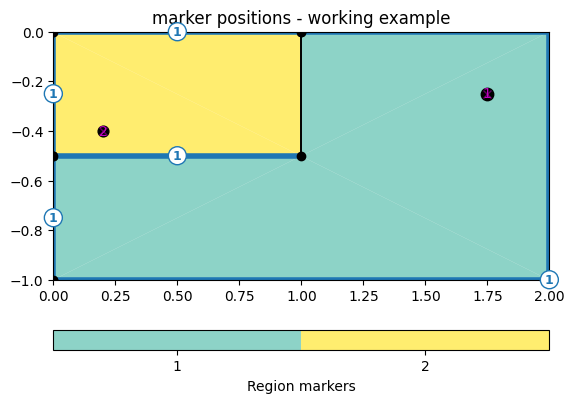
Position marker number 1: 1.75 -0.25 0.0
Position marker number 2: 0.2 -0.4 0.0
Note
This tutorial was kindly contributed by Maximilian Weigand (University of Bonn). If you also want to contribute an interesting example, check out our contribution guidelines.